

4 Steps to Defining GREAT Metrics for ANY Product
Developing metrics from scratch is daunting because so much is at stake. Here's a mental model and framework (GAME) you can use for new products, existing products, and even PM interviews.
May 8, 2017
Originally posted on Medium via Hacker Noon.
In this series…
- Part 1: WTF is a Metric? — introduction to the basics of metrics, what it is, and why it matters.
- Part 2: 4 Steps to Defining GREAT Metrics for ANY Product — how to develop a metric from scratch.
- Part 3: WTF is Your Metric Doing to Your Customers? — how to avoid the unintended consequences of the “one metric that matters.”
Metrics matter. Your product’s success is dependent on and defined by metrics. Metrics are a lens into your product’s health and performance. Defining your metrics, therefore, should be as intrinsic to your product development process as defining requirements.
In fact, metrics are one of the most frequently asked product manager interview questions:
How would you define the success metric for feature X?
The Challenge
Developing metrics from scratch can be incredibly daunting, precisely because there is so much at stake. Unless you work in an industry where standard metrics are widely accepted (such as in gaming, e-commerce, or retail), metrics are anything but trivial.
Many product managers start bottom-up: monitoring and collecting the near-infinite number of data points they can get a hold of. However, an obvious truth quickly begins to surface…
…not all data are created equal.
Just because you can track everything doesn’t mean you should. Some data are more valuable than others because they give you a unique insight into your product’s health. Conversely, there is a lot of subpar data that can cloud your judgement.
A Mental Model for Metrics
Let’s step back. Think about your product as a box:

You can start to instrument this box and collect all available data, but this can become an aimless approach characterized by constant trial-and-error.
In order to build a product your users value, you first need to determine the inputs and outputs of this box. Your inputs are anything your users come to you with: their problems and their resources. Your outputs are the circumstances resulting from the use of your product. These become your goals.

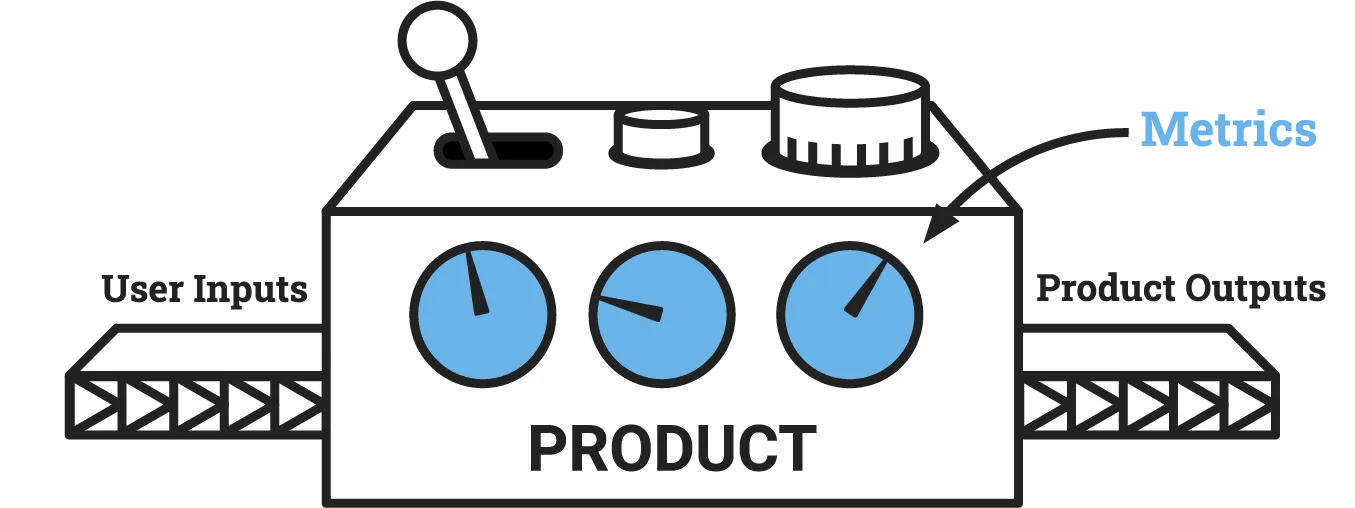
But this is not a black box. Most products require the user take actions within the product to extract value and achieve their goals.
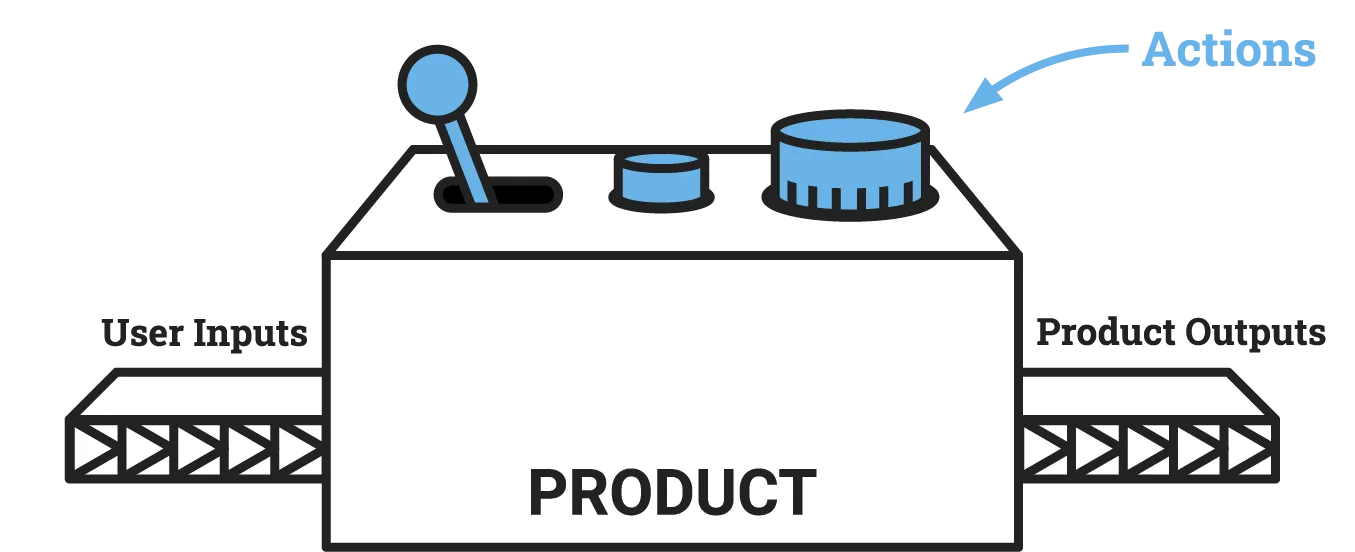
Quantifying and measuring these actions gives you insights into how (and how many) users are getting value from your product. When you track these actions over time, they become your metrics.
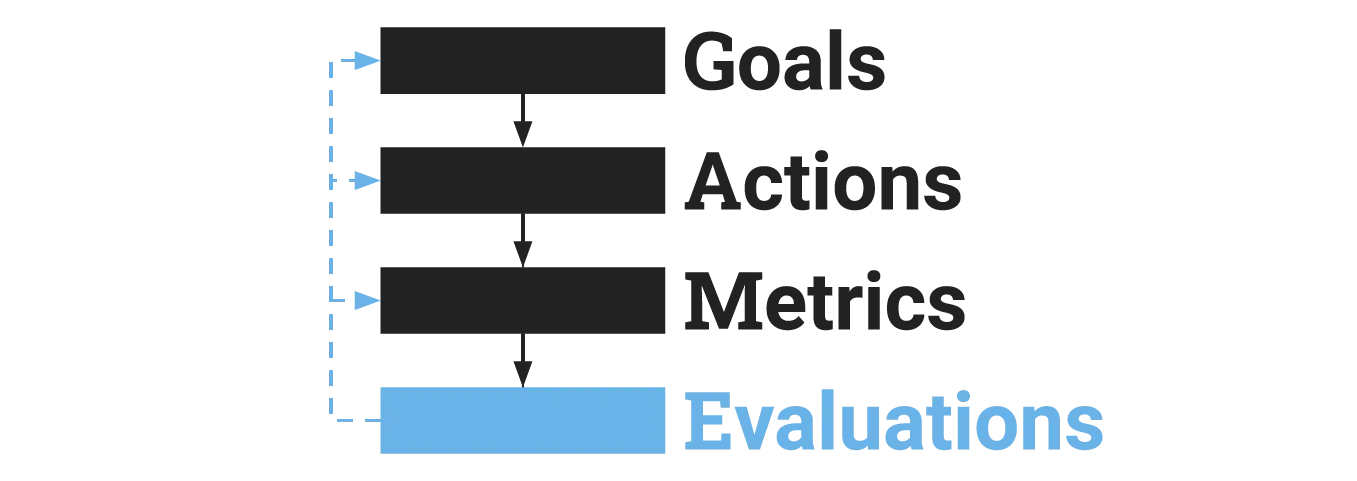
Once you start to collect data for your metrics, you can then put them to work towards evaluating your product. The results of your evaluations can inform any number of adjustments in your goals, actions, or even metrics themselves.

You can start to see that this very simple model can be applied in any number of ways:
- Defining success metrics for a new product
- Determining a new feature’s success and impact
- Re-vamping metrics for an existing product
- Fielding interview questions about metrics
For each step, here’s a bit more detail on how to do this.
The GAME Framework
The GAME framework is a 4-step process that can define metrics for any feature or product. For the remainder of the post, I will refer to a hypothetical “product” but feel free to substitute in “feature” whenever a “product” is discussed.
Step 1: Articulate Your Goals

This is obvious, but you should always start by defining your goals for your product. Your goals are critical to ensuring that you maintain a purpose-oriented strategic mindset. They also serve as tangible markers for revisiting and validating directional correctness throughout the metrics development process. Placing goal-setting as your first step forces you to be top-down, which is critical for developing metrics. A bottom-up approach is suboptimal because it relies on intuition and can often lead to analysis paralysis.
To define your goals, ask yourself the following questions:
- User Goals: How will my users benefit from my product? What problems do my users want my product to solve for them? How will my users interact with the product? How will my users feel when they use my product? What is my vision for how this product will integrate in my users’ life?
- Business Goals: What are the tactical or strategic business benefits? Increase revenue? Decrease cost? Be more competitive? Enter a new market? What does my business look like if my product is successful?
Note that for many of the best products, user and business goals align. These goals are often two sides of the same coin.
Once you have this set, you are ready to get in on the action.
Step 2: List the Actions That Matter

The next step is to define your user actions, or more precisely, all the actions you want your users to take within your product. This should start as a qualitative list. Don’t worry about the numbers or whether they are trackable yet.
Here are some example questions you may ask yourself using the common ARM metrics framework. Pick the set of questions that align with your goals:
- Acquisition & Activation: How will my prospective users hear about my product? What actions do my prospective users have to complete to become a user of my product? What actions do my users have to take to get value from my product? At what point is my product solving a real problem for my users?
- Retention & Engagement: What gets my users to come back to my product? What do my users do when they are engaged with and interested in my product? What are the actions that provide my users repeat value? How often does it make sense for my users to take those actions? Daily? Weekly? Monthly? Once in a long while?
- Monetization & Revenue: What form of “payment” does my user purchase with, money or time? What actions do my users take for my product to start charging? If my product is free, what are the reasons my users will opt to pay for it? Do they pay me directly or does someone else pay me when my users take action (e.g. ad/affiliate)? Do they pay me for every action (transaction) or do they pay me periodically (subscription)?
You can also use metrics frameworks like AARRR to flush out the actions. The key to doing this well is to be comprehensive but not exhaustive: have the broadest coverage, but don’t bother differentiating the minutiae. For example, if your acquisition user action is “newsletter signup,” don’t worry (yet) about listing each newsletter sign-up interface.
Step 3: Define Your Metrics

You are now ready to turn each desired user action (qualitative) into a measurable, trackable value (quantitative). Note that if you haven’t already done so, bring engineering and data teams in at this stage to vet your metrics and provide technical guidance on the feasibility of collecting/storing the desired data.
Here are some major decisions for how to count each action:
- Direct vs. Proxy: Can the action be directly tracked? Or do you have to use a proxy to measure the action? For example, you can measure “clicks” directly, but you may need to proxy “views” with values like scrolling.
- Individual vs. Aggregate: Can you group many actions for an overview, then separate out as slices for later analysis? For example: total revenue → revenue by product line → revenue by individual product.
- Magnitude vs. Ratio: Does it matter more for you to measure the overall magnitudes of the action? Or should you track as a comparison using a ratio, whether it be a rate (per time) or a normalizing factor (percentage, per user, etc)? For example, you can measure “total revenue,” or you can measure “revenue per day” and “revenue per payer,” which will give you very different perspectives on the same data.
- Intrinsic vs. Heuristic: Can you derive more knowledge from the measure intrinsically? Or do you have to rely on heuristics for the metric to be valuable? For example, while “daily active user” (DAU) may be intrinsically useful for B2C apps, a heuristic like “number of paying users who were active in the last 30 days” may be more appropriate for B2B SaaS products that are expected to be used monthly.
For most, this is the hardest step in the framework. Some of your decisions are informed by strong intuition, while others are informed by technical constraints or further data analysis. Often you won’t know for certain whether a metric is working until some iterations.
At this stage, you can also begin to weed out vanity metrics. Tweak the metrics that can be “gamed,” i.e. artificially inflate or deflate through clever design/engineering or malicious user intent. For example, inflating page views by using pagination or slide shows.
Step 4: Evaluate your Metrics
The best way to ensure your metrics are providing you the correct insights into your product is to test and iterate. You simply will not know how a metric behaves until you start collecting data.
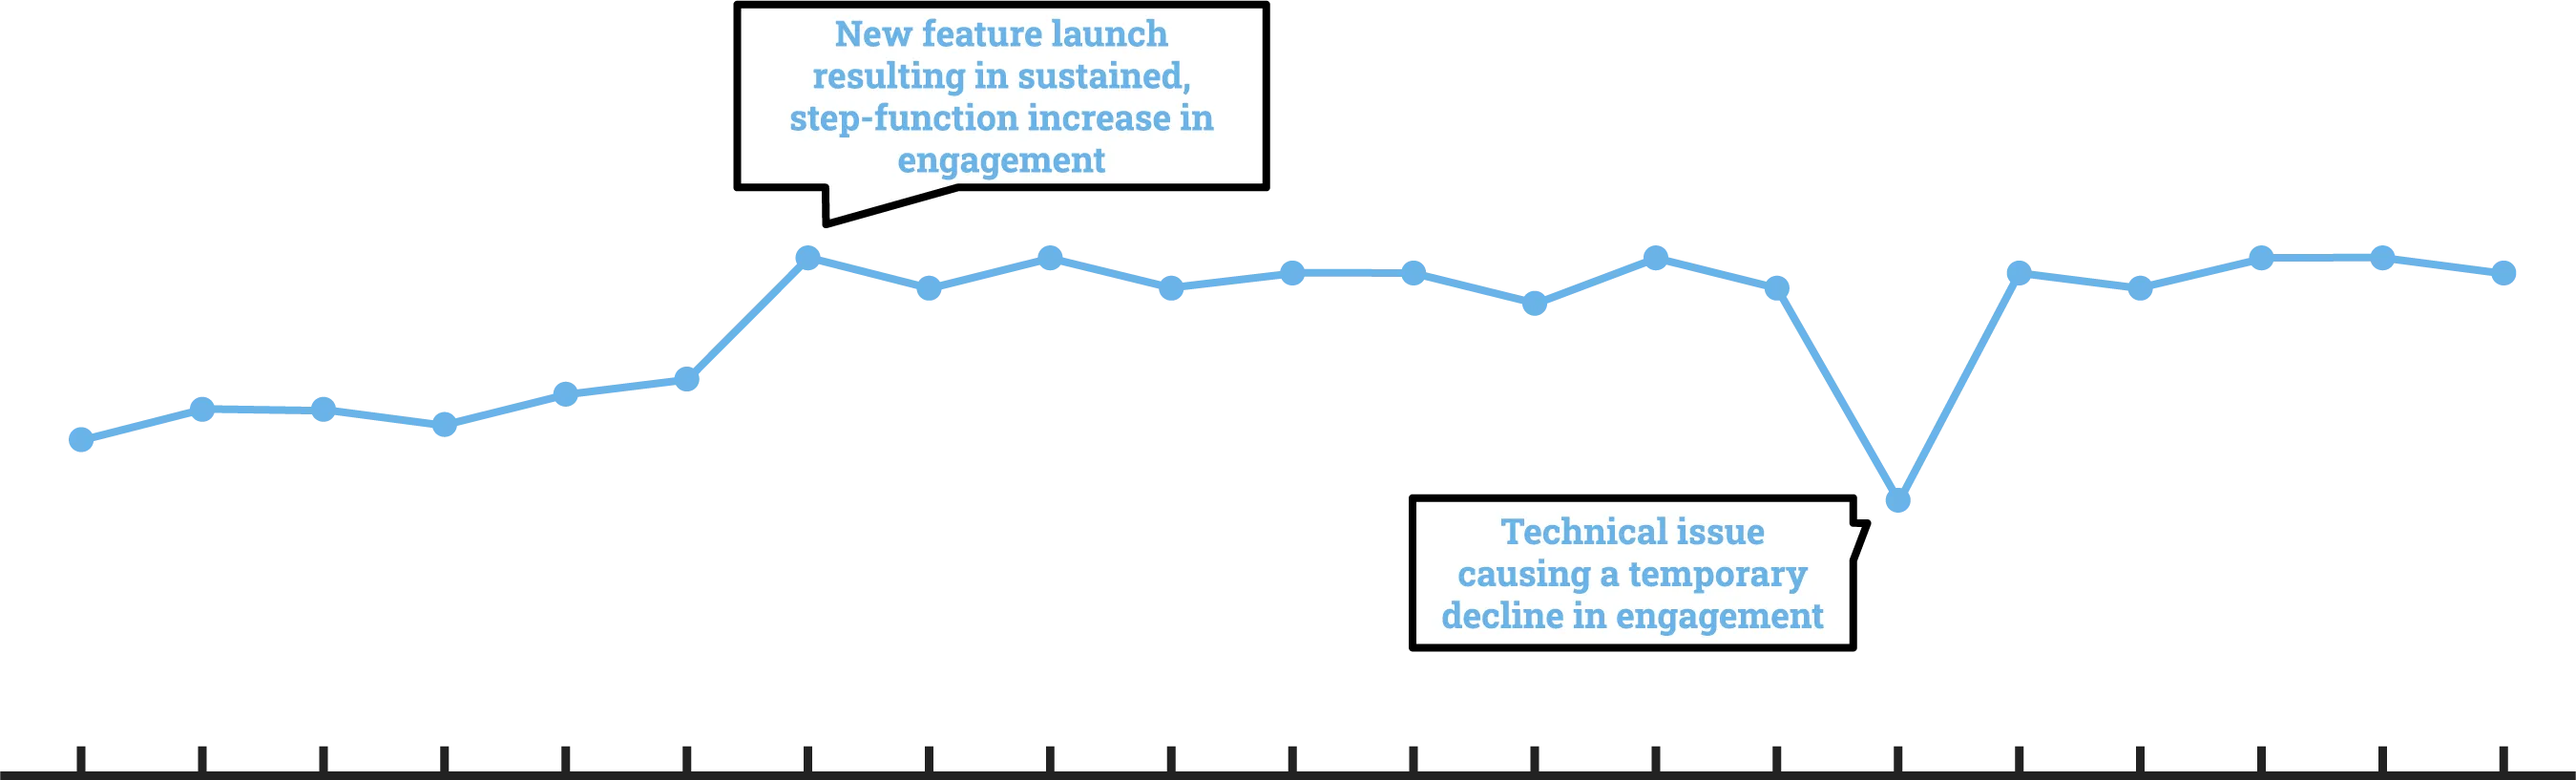
The most import evaluation you need to make is the functional usefulness of the metric. You can check for usefulness by monitoring the metric for any false-positives or false-negatives. For example, if the metric drops, does it signal a real problem in the product? Conversely, if an issue surfaces, is the metric helping you flag this issue? Of course, you would also expect the metric to flag true-positives and true-negatives.
Different behavior with your metrics may inform iterations in each of your GAME steps:
- Evaluating Metrics: Is the data trending in the way you expected? Is the metric stable over time (i.e. not wildly fluctuating)? Is the metric flagging issues with your product and prompting further analysis? Are these the correct data points to collect? If you answer “no” to any of these questions, you want to reconsider how you developed your metrics.
- Evaluating Actions: Are these actions reflective of product, user, or business goals? Are your key actions telling the correct story about user behavior? Does your action set cover all emerging user behaviors? Are your actions safe from being “gamed” by your users? If you answer “no” to any of these questions, you want to redefine the set of key actions.
- Evaluating Goals: Is the metric correlating to business or user success? Are your users happier when your metrics are positive? If you answer “no” to any of these questions, you want to revaluate how your metrics relate to your goals.
Ask yourself these honest questions and remember that you are looking for your metrics to measure the vital signs that give you an actionable indication of health and performance.
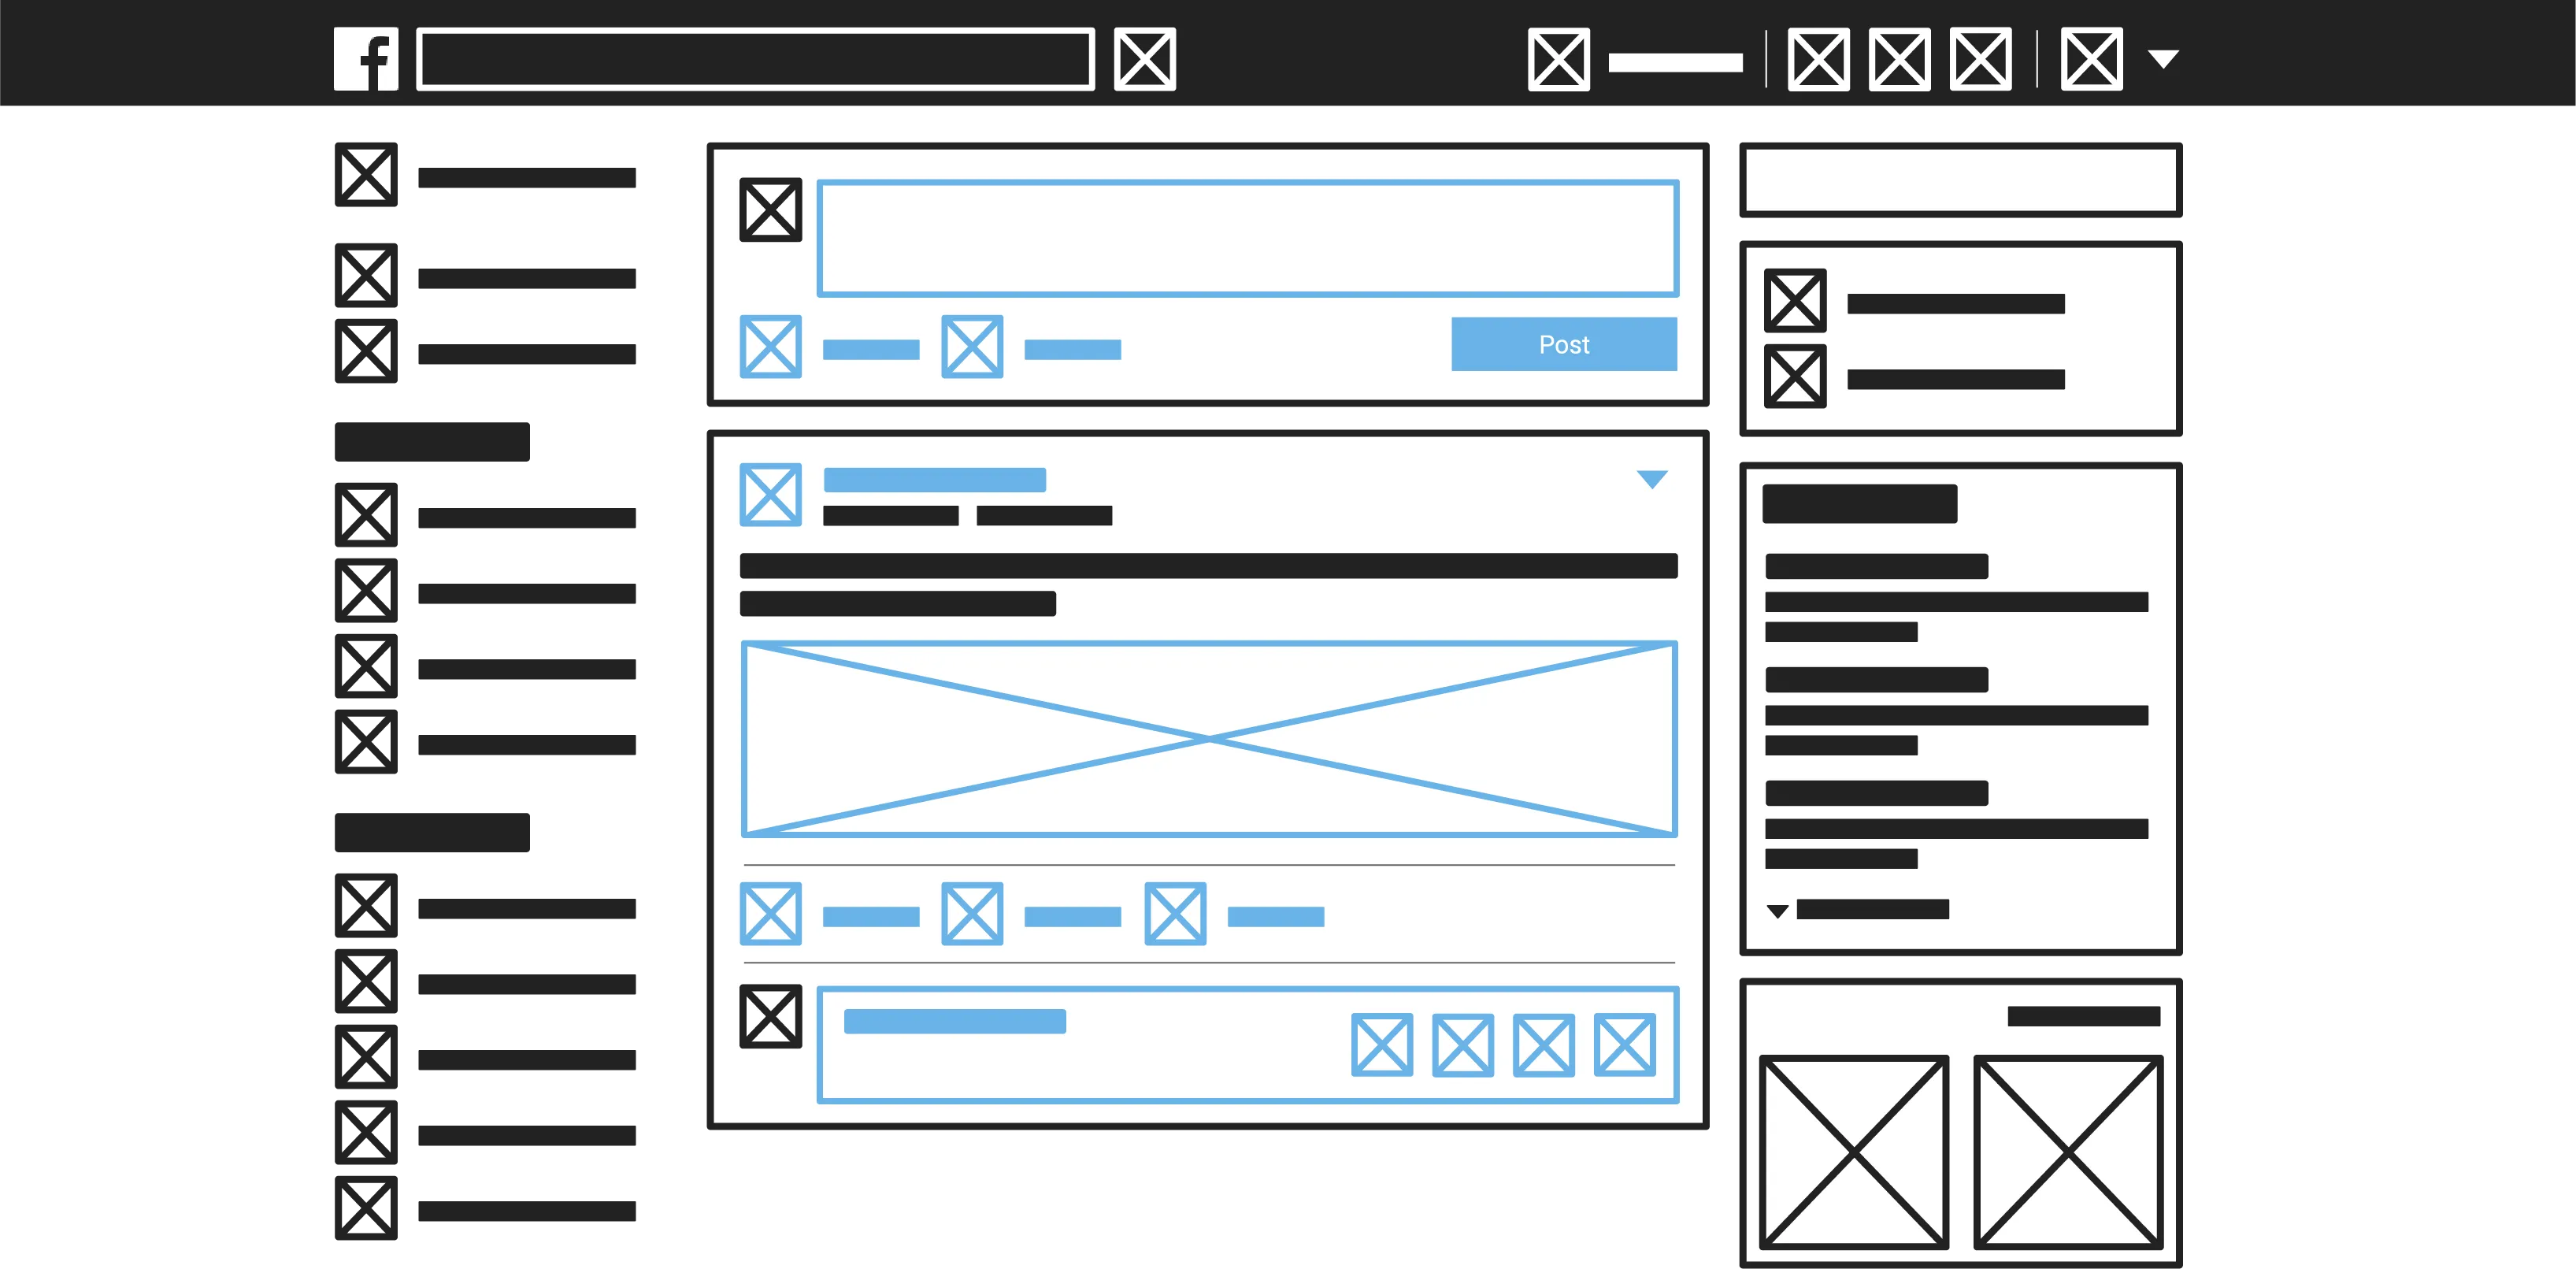
Applying GAME: Facebook’s Newsfeed Example
Disclaimer: I have no insider information from Facebook. This section is pure speculation. 😇
The Facebook Newsfeed comes up as one of the most common interview questions, particularly because it has the right mix of ubiquity, complexity, and opaqueness.
Let’s apply the framework step-by-step:
Goals for the Newsfeed can be broken down between user and business goals:
- User Goal: I want to be able to see the latest of what my friends are up to without going to each of their profiles.
- Business Goal: Users are only coming to Facebook when they have a reason to: they are looking to post or they have been messaged/mentioned. We want to improve engagement by creating an evergreen content discovery experience.
Actions taken on the Newsfeed can be collected into the following qualitative list when considering “engagement” as the primary goal for both user and business:
- Logging into Facebook to look at Newsfeed
- Posting to Newsfeed (text, photo/video, photo/video album, live video)
- Viewing Newsfeed items, including watching a video
- Scrolling through the Newsfeed
- Clicking on Newsfeed items (content, name/photo of the poster)
- Commenting or replying to a comment
- Liking a Newsfeed item or a comment
- Sharing a Newsfeed item to your own or someone else’s wall (person, page, group), or as a private message
- Saving a post (yes, you can look at saved posts later… who knew?)
- Hiding, unfollowing, reporting, or turning off notifications for a Newsfeed item
Notice how the list is relatively comprehensive but not exhaustive: it covers all of the bases but doesn’t try to split hairs between all the different post, click, or comment types. We can also see how product design around creating or changing actions can be a major lever for impacting engagement.
Metrics is where this gets interesting. In trying develop the most useful, actionable metric, we can vet them through our various decision points:
- Direct vs. Proxy: Most of the actions above can be tracked directly with clicks except for viewing a feed item. For viewing, we may use a proxy to count the number of items viewed, such as “count viewed if 75% of the feed item is in the device viewport.”
- Individual vs. Aggregate: Because our primary goal is measuring engagement, we care about our users engaging with the Newsfeed in general more than any specific action, so we will define a metric with aggregate measures. With that said, some actions (like posting) are more valuable to us, so we may choose to group them differently. For example, we can aggregate Newsfeed posting actions into the first bucket, viewing actions into a second bucket, and interacting actions (inclusive of links, comments, share, blocks) into a third.
- Magnitudes vs. Ratios: Looking at the magnitude of Newsfeed action is relatively meaningless since any given user can generate a great number of actions. It is more useful if we consider either actions-per-day or actions-per-user (or both, i.e. actions-per-user-per-day).
- Intrinsic vs. Heuristic: Unfortunately, there’s no easy measure to determine whether someone is “engaged” or not. Let’s say a hypothetical analysis shows that people who post at least 1 feed item OR view at least 20 feed items OR interact with at least 3 feed items are 2x more likely to come back to Facebook the next day. We can use this data to develop a heuristic around an engagement metric, whereby if a user crosses any of the three thresholds above, they are considered “engaged.”
Pulling this all together, our metric for the Facebook Newsfeed will look something like this…:

…where “engaged user” is a heuristic that’s developed by aggregating both direct and proxy actions and comparing it as a ratio to “total users” on a daily basis.
Evaluations will come in the form of validating many of the assumptions we made above by putting your newly defined metric to work. For example:
- Honing Heuristics: We may find that the definition around “engaged user” is overly permissive and that 90% of our users are regularly considered “engaged,” which doesn’t leave much room for insight or improvement. We dig deeper to find that of the 90%, a majority became engaged through the “view at least 20 feed items” criteria, so we adjust that threshold up to 50 to create a higher bar for an engaged user.
- Disaggregating Actions: We may find that people who take actions against negative posts (hiding, unfollowing, reporting, or turning off notifications) actually correlates inversely to engagement. From this, we can decide to pull these actions out of our “interacting” bucket (bucket 3) and develop a separate metric to monitor negative Newsfeed behavior.
- Shifting Goals: We may find that we’ve done such a great job on engaging users with the Newsfeed that engagement is no longer the primary goal. Instead, we may decide to shift the goal to “monetization,” where we develop ad-related features into the Newsfeed. While engagement may not be the primary goal anymore, we want to continue monitoring the engagement metric to ensure the new monetization features do not have an adverse impact on engagement.
A Case for Defining Your Metrics Before You Need Them
In a “move fast and break things” world, it is tempting to concern yourself with metrics only after the product has launched. However, having metrics defined before you start development can translate to huge benefits because:
- Metrics help you maintain focus
- Metrics set a common goal for team to rally around
- Metrics hold you (the PM) accountable to your users and business
- Metrics enable more objective decision-making during the critical launch period, including triage and prioritization
Flying blind at any stage of your product’s lifecycle will substantially decrease your ability to learn. After all, you can’t improve what you don’t measure. Having the right data up front may be difference between success and failure for a startup!